Growth Charts and Calculators
Please let us know if you have any questions about these growth charts and calculators or any difficulties in using them.
WHO growth charts for Canada
In 2010, the WHO Growth Charts for Canada were released and were recommended as the standard growth charts for all Canadian children, to replace the CDC growths in use since 2000. The formatting of the 2010 charts was the result of a collaborative statement (PDF) by the Dietitians of Canada, the Canadian Paediatric Society, the College of Family Physicians of Canada and the Community Health Nurses of Canada.
A number of individuals and professional organizations, most notably the Canadian Pediatric Endocrine Group (CPEG), raised three concerns about the new WHO charts.
In particular, CPEG felt that the loss of weight-for-age curves from ages 10–19 years in favour of a sole emphasis on the calculation of body-mass index (BMI) made the charts less useful for short-term clinical evaluation of weight gain or loss in growing children.
Secondly, the inclusion of curves for the 0.1st and 99.9th centiles in the 2010 charts raised the possibility of some physicians considering these extremes as the “normal range”, possibly delaying referral of children until they reached one of these extremes.
Finally, the loss of the number of intermediate-centile (10th, 25th, 75th and 90th) curves on the 2010 charts made it potentially more difficult for clinicians to identify children who were “crossing centiles”.
CPEG therefore undertook to recreate the weight-for-age curves for children 10–19 years of age, using a statistical method (PDF) identical to that used by WHO, and including the majority of the data points in the WHO curves. Following discussions between the original collaborative group and CPEG, they achieved a consensus in March 2014, whereby two sets of growth charts would be released, both including the new weight-for-age curves developed by CPEG and differing only in the percentiles plotted:
- Set 1 uses centiles 3/15/50/85/97 (roughly −2/−1/0/+1/+2 standard deviations) on all charts and includes the 99.9th centile (+3 SD) on the weight-for-length (0–24 months) and BMI-for-age (2–19 years) charts
- Set 2 uses centiles 3/10/25/50/75/90/97 on all charts, substituting the 85th for the 90th centile and retaining the 99.9th centile on the weight-for-length (0–24 months) and BMI-for-age (2–19 years) charts. The 85th centile was used on the weight-for-length and BMI charts to correspond to the cut-off for obesity in adults
English and French versions of both sets of growth charts are freely available for download at www.whogrowthcharts.ca, with instructions for printing them. The LMS data used to plot the charts (ZIP file) are available on the CPEG website.
BC Children’s Hospital has now printed and integrated the use of the Set 2 consensus charts. We encourage all clinicians and public health clinics seeing children in BC to switch to the revised WHO Growth Charts for Canada. The BC Ministry of Health is working to ensure that this occurs on the public health side as well.
Growth chart downloads
- WHO Growth Charts Adapted for Canada: Summary of changes – March 2014 (PDF)
- A Health Professional's Guide for using the WHO Growth Charts for Canada (PDF)
- WHO Growth Chart Assessment and Counselling: Key messages and actions (PDF)
- WHO Growth Chart Training Program (sign-in required)
- Instructions for Viewing and Printing Growth Charts (PDF)
Anthropometric calculators
A number of resources are available on this website and that of the Canadian Pediatric Endocrine Group to assist clinicians in calculating Z-scores and centiles for anthropometric data for typically growing children, children with syndromes, and premature infants.
Microsoft® Office Excel® workbooks
The BC Children's Hospital anthropometric calculators can calculate Z-scores and centiles for height/length, weight, head circumference, body-mass index, waist circumference, waist/height ratio, BMI, blood pressure (2004 NHBLI and 2017 AAP), skinfold thickness, arm circumference, height velocity, target (midparental) height, and predicted adult height for typically growing children and for children with selected syndromes, based on published norms.
There are four calculator workbooks. These workbooks are free and do not contain macros. You may use them online or download and save them to your hard drive or mobile device.
Anthropometric calculator downloads
Download (current version: 2023/08/12)
Based on the World Health Organization (WHO) Growth Charts for Canada (2014 revision).
Also contains calculators for blood pressure (using NIH 2004 or AAP 2017 references), waist circumference, arm circumference, triceps and subscapular skinfolds, target (midparental) height, predicted adult height, and height velocity for healthy children.
The formulae for converting non-Gaussian physical measurements into Z-scores are strictly valid only for −3 < Z < +3, with more extreme values compressed as the conversion formulae plateau asymptotically. The WHO has addressed this issue by introducing the “SD23 correction method” for Z-scores outside this range. We apply this correction for WHO Z-scores for weight- and waist circumference-based measures (weight, body-mass index, weight-for-length, weight-for-height, waist circumference and waist-height ratio) with this calculator.
Please also note that the WHO has made its free Anthro and AnthroPlus software available to do these calculations in these two age groups, respectively.
Download (current version: 2023/08/12)
Based on the US Centers for Disease Control and Prevention (CDC) 2000 growth charts (available online at http://www.cdc.gov/growthcharts/).
Also contains calculators for blood pressure (using NIH 2004 or AAP 2017 references), waist circumference, arm circumference, triceps and subscapular skinfolds, target (midparental) height, predicted adult height, and height velocity for healthy children.
The formulae for converting non-Gaussian physical measurements into Z-scores are strictly valid only for −3 < Z < +3, with more extreme values compressed as the conversion formulae plateau asymptotically. The CDC has simply reported extreme values as “≤−3 SD” or “≥+3 SD”, for percentiles ≤0.1% or ≥99.9%. We report raw CDC Z-scores for weight- and waist circumference–based measures (weight, body-mass index, weight-for-length, weight-for-height, waist circumference and waist-height ratio) with this calculator.
Please note that the CDC has made a nutrition module in its free Epi Info™ software available to do these calculations.
Download (current version: 2023/01/14)
This calculator calculates Z-score and percentiles for height/length, weight and BMI values, using either WHO or CDC references, as with the two calculators above.
Extended BMI-based measures of obesity are also calculated, based on the median and upper-limit-of-normal (97th centile for WHO, 95th centile for CDC) for BMI for age: age-corrected percent distance from the median, using the method of Freedman et al [Br J Nutr 2020;124(4):493–500]; age-corrected percent distance from the ULN; and percent of the ULN. For CDC calculations, in addition to raw CDC Z-scores for BMI, the calculator also provides the “modified BMI-Z”, using the method of Hales et al [NCHS Vital Health Stat 2022;2(197)], as well as the “extended BMI-Z”, using the method of Wei et al [Ann Hum Biol 2020;47(6):514–521].
Download (current version: 2023/05/20)
Based on various published norms (references in workbook).
- Anthropometric Calculator for fetal growth for 14–40 weeks of gestational age (Excel) (current version: 2025/01/10), based on the WHO Fetal Growth Charts [PLoS Med 2017;14:e1002220], available online at https://srhr.org/fetalgrowthcalculator/
We have a number of Microsoft® Excel workbook–based batch calculators available, to be used in conjunction with the above calculator workbooks.
Please note that these workbooks contains macros, which will have to be enabled for them to work. For each batch calculator, there is a worksheet in its workbook with instructions for use.
Please also note that these workbook files and the associated anthropometric calculator files must be placed in the same folder on your computer's hard drive or network drive. Users have reported problems using this with Macs that we have been unable to resolve.
Currently available:
- Growth Z (XLS) (current version 2022/12/18), to do batch calculations for WHO and CDC parameters, as well as 2017 AAP BP. Requires the WHO and/or CDC calculator above, as desired
- Obesity Z (XLS) (current version 2023/01/14), to do batch calculations of extended measures of obesity. Requires the obesity calculator above
- Head Circumference Z (XLS) (current version 2022/01/02), to do batch calculations of head circumference for people 0–21 years of age, based on references from Rollins JD, Collins JS, Holden KR. J Pediatr 2010;156(6):907–913. Requires the WHO calculator above
- Height Velocity Z (XLS) (current version 2023/02/15), to do batch calculations of growth velocity of children, based on references from Kelly A, Winer KK, Kalkwarf H, Oberfield SE, Lappe J, Gilsanz V, Zemel BS. J Clin Endocrinol Metab 2014;99(6):2104–2112. Requires the WHO calculator above
Image
Our AnthroCalc app is available on Google Play and on the App Store.
The AnthroCalc app calculates centiles and Z-scores for height/length, weight, weight-for-length, body-mass index, waist circumference, head circumference, target (midparental) height, predicted adult height, and height velocity for typically growing children (using WHO or CDC references); for blood pressure (using NIH 2004 or AAP 2017 references); for children with a number of syndromes (Turner, Down, Prader–Willi, Russell–Silver and Noonan); and for preterm infants (Fenton, INTERGROWTH-21st).
Image

Image

This option is for those wanting to use these CPEG macros in a clinical or research context, but who are uncomfortable with a statistical package.
The Canadian Pediatric Endocrine Group has created on-line applications (Zapps™) running these macros on an R server (a.k.a. Shiny), available on the Canadian Pediatric Endocrine Group website.
Growth chart plotter apps
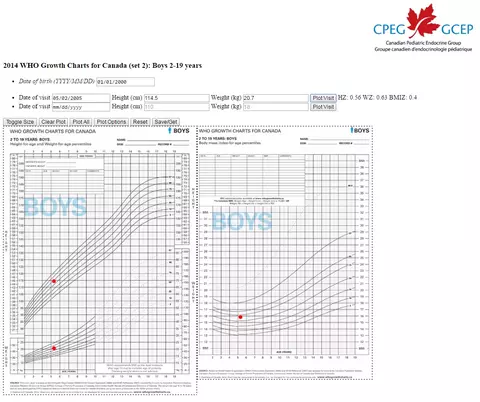
Dr. Atul Sharma, MD, MSc, FRCPC, assistant professor, Department of Pediatrics and Child Health, University of Manitoba, has developed a web-based height-, weight- and BMI-plotting app for children from birth to age 19 years, using the WHO Growth Charts for Canada, 2014 revision. You can use the app to make images of plots for presentations (see screenshot below).
This app requires an HTML 5-compliant browser with JavaScript (e.g. Safari, Chrome, Firefox, or Opera), and it will not work with current versions of Microsoft Internet Explorer or Edge.
Set 2 plotters:
Plotters for Set 1 are also available.
Image
For those who prefer to create growth charts by uploading anthropometric data in spreadsheet (csv) format, the Canadian Pediatric Endocrine Group has created Shiny plotters:
Or if you prefer to combine direct data entry with the versatility of Shiny:
Image
Our GrowthPlot app is available on Google Play and on the App Store.
The GrowthPlot app plots length, weight, head circumference and weight-for-length for children (0-24 months of age for WHO, 0-36 months for CDC); and it plots height, weight and body-mass index for children (2-19 years of age for WHO, 2-20 years for CDC). Plots for WHO are made using the WHO Growth Charts for Canada, March 2014 revision, and plots for CDC are made using the 2000 CDC Growth Charts.
You can also choose to plot selected growth parameters (such as height, weight, body-mass index and head circumference) for children with a number of syndromes (Turner, Down, Noonan, Prader–Willi and Russell–Silver).
Image
Image